Data and Infrastructure Monitoring Reinvented: How Telmai, Better Stack, and Robusta Deliver AI-Powered Operational Intelligence for DevOps Teams
1. Introduction: The Monitoring Quagmire in Modern DevOps
Did you know that piling on more monitoring tools often worsens outages rather than preventing them? It’s a brutal paradox I’ve faced countless times: after painstakingly building dashboards, alerts, and traces, your system erupts in a cacophony of false alarms just when it can least afford it. Kubernetes, as magnificent as it is, turns monitoring into an exhausting guessing game, where noise drowns out signal.
I recall one particularly sleepless night when alerts flooded in from every corner. Yet, the root cause hid silently behind misreported pod health—the very insights we trusted turned traitor. Traditional monitoring tools crumble under the weight of dynamic workloads and sprawling data pipelines, morphing engineers into zombified alert drones. As incidents escalate from subtle data corruption to catastrophic pod failures, MTTR (Mean Time to Recovery) stretches agonisingly long. If this sounds familiar, you’re not alone.
This is the wicked heart of modern observability—and a problem I’ve dissected deeply in Open-Source Observability Revolution: How Uptrace, OpenObserve, and Vector Solve Complexity, Cost, and Performance Bottlenecks in Modern Systems.
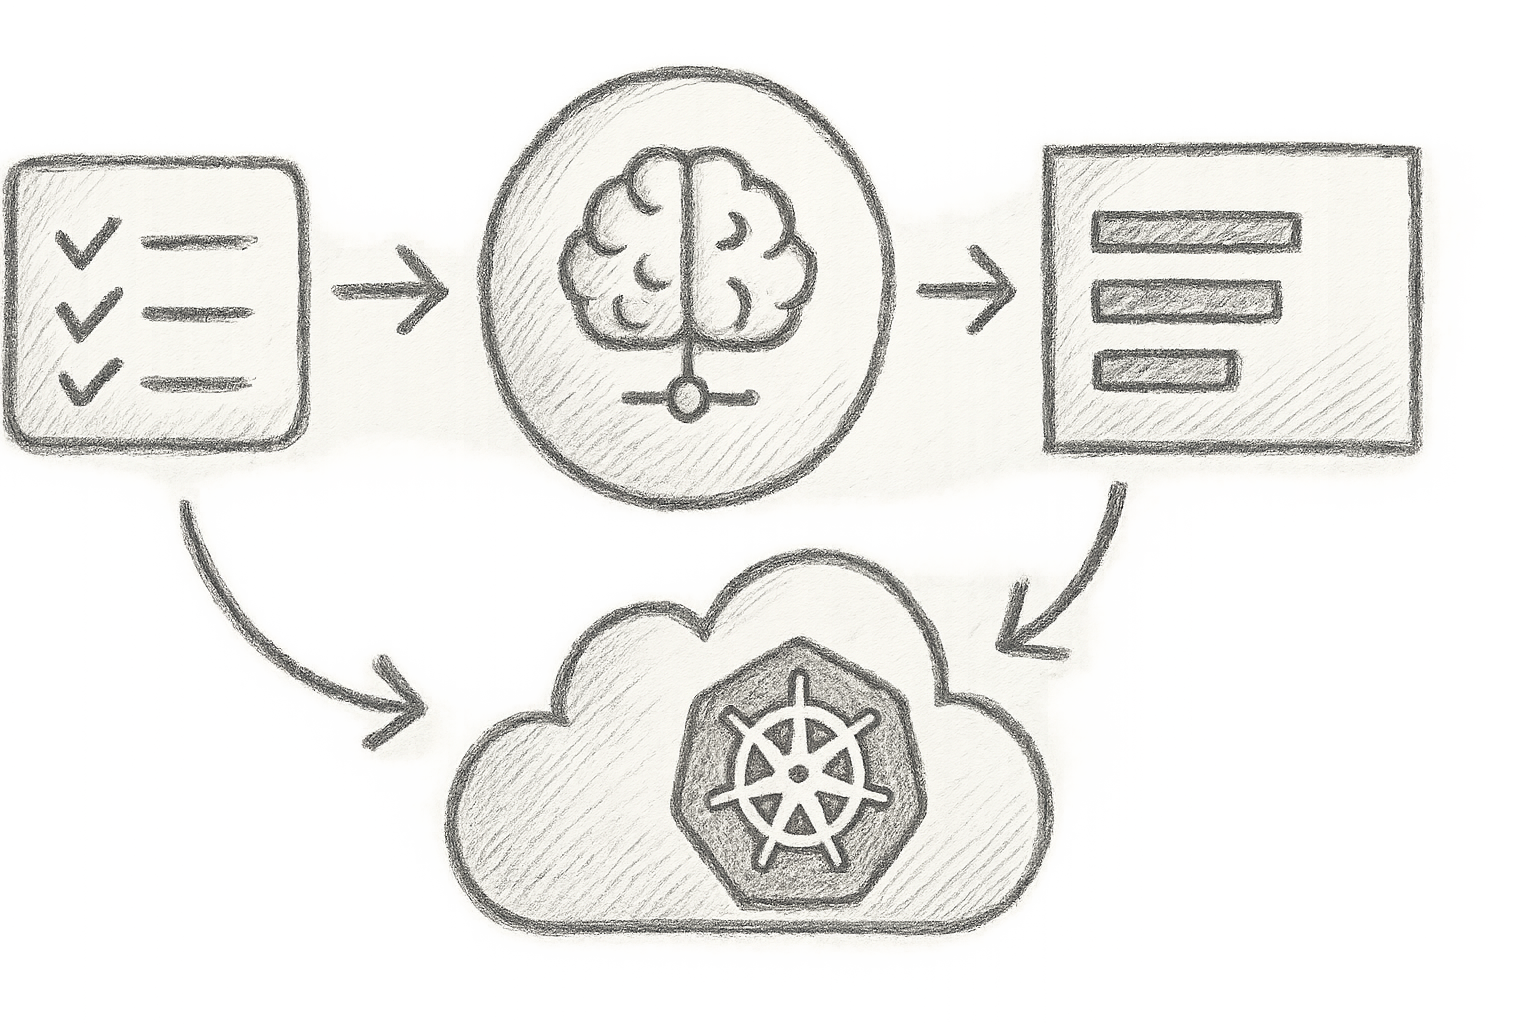
Now, imagine an alternative: three AI-powered platforms—Telmai, Better Stack, and Robusta—that transform drowning in noise into surfing the perfect wave of operational intelligence. How? Let me show you.
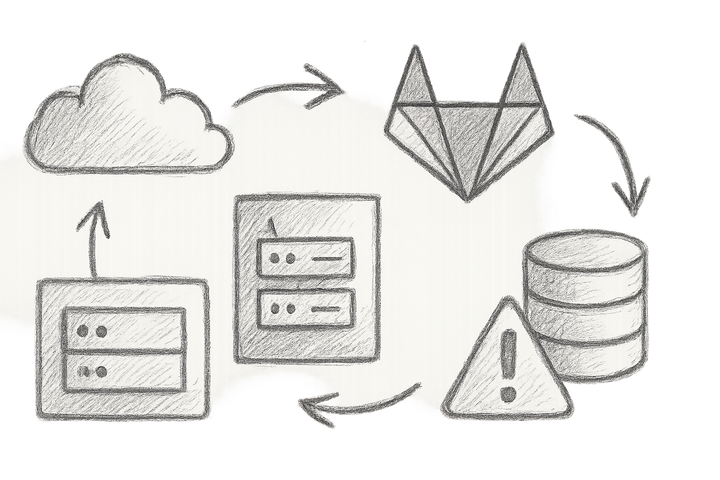
2. Telmai: AI-Driven Data Observability for Real-Time Data Validation
The Problem: When You Can’t Trust Your Data
Ever discover that your critical dashboards are fed by quietly corrupted data? That sinking feeling when compliance audits find holes despite “all green” lights—trust me, I’ve lived it. Data pipelines are fragile labyrinths; data freshness, completeness, and correctness wobble on unseen faults. Traditional tools blink obliviously while your SLAs crumble.
Telmai’s Game-Changer: Intelligent Real-Time Validation
Telmai is no mere schema enforcer—it’s an AI-powered watchdog learning the statistical heartbeat of your datasets. It detects weird deviations before alarms even know to trigger, slicing through false positives like a hot knife through butter.
How We Rolled It Out
Plugging Telmai into our data mesh was oddly satisfying: open connectors streamed data validation demands that automated from scratch. Completeness checks, distribution shifts, and cross-table relationships all danced seamlessly.
from telmai_sdk import DataValidator, ValidationError
import logging

logger = logging.getLogger(__name__)
validator = DataValidator()

try:
    validator.validate_table("user_activity", checks=["completeness", "distribution_shift"])
except ValidationError as e:
    logger.error(f"Data validation failed: {e}")
    # Trigger alert pipeline or auto-remediation here
This snippet isn’t just cute code—it’s a living guardian refining “normal” from history, trimming false alarms that traditional tools drown you in. No more crying wolf every time a batch runs slow.
Case in Point: Catching the Uncatchable
We encountered a sneaky bug where a data ingestion script sporadically injected nulls into our star column. Telmai’s AI spotted a subtle distribution anomaly instantly. Our legacy dashboards? Deafeningly silent. That’s the difference between dodging a total compliance breach and stumbling blindly.
What to Watch Out For
Warning: initial tuning demands patience. Throwing in misfired thresholds or checks just invites noise back to the party. Be prepared to iterate with your data engineers religiously.
For a broader angle on real-time metrics and session insights, see Specialized Monitoring Solutions for Modern Applications.
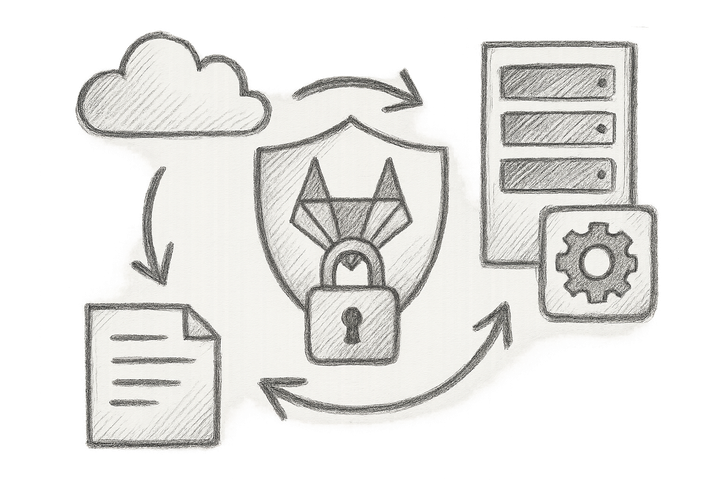
3. Better Stack: Intelligent Incident Management with AI-Powered Log Analysis
The Problem: Logs Are Like Drinking from a Firehose
Logs are a relentless flood, especially in Kubernetes—containers starting and stopping like caffeine-fuelled rabbits. If you’ve ever tried to grep your way to salvation on-call, you know the pain. Static alerts are archaic; they drown you in noise while the actual fire smoulders unseen.
Better Stack’s Solution: AI That Thinks Like You (Or Smarter)
Enter Better Stack, digesting logs with AI that correlates events, assigns severity, and curates root cause guesses. Honestly, if you enjoy babysitting grep, this might challenge your masochism.
Setting It Up
Deployment is delightfully simple. One YAML apply and the agent swallows log streams, applying AI-driven incident silencing and diagnosis.
# Install Better Stack agent on Kubernetes
kubectl apply -f https://betterstack.com/deploy.yaml
Then, their AI MCP Server—a charmingly brilliant assistant—takes over: analysing incidents, drafting status updates, guiding post-mortems.
import betterstack

try:
    incident = betterstack.analyze_incident(logs="recent_pod_crash_logs.log")
    if incident.suggested_actions:
        print("Recommended Fix:", incident.suggested_actions)
except Exception as e:
    print(f"Error analyzing incident: {e}")
    # Optionally trigger fallback manual investigation
Balancing AI and Human Insight
Trust is hard-earned here. Better Stack wisely allows manual overrides and contextual tweaks. From experience, teams that treat AI as an assistant—not a replacement—slash incident resolution by up to 40%. That’s a full night of sleep regained.
Pitfalls and Workarounds
Legacy log formats? They don’t always play nice out of the box. Spending upfront effort on log normalisation saves you long-term headaches.
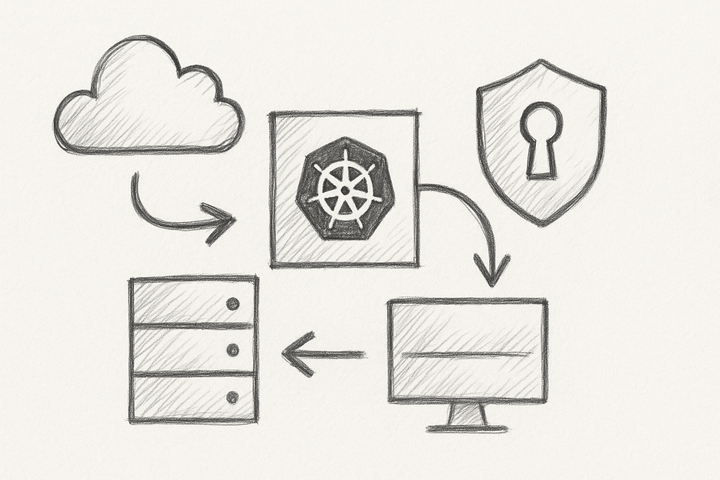
4. Robusta: AI-Powered Kubernetes Troubleshooting and Prometheus Alert Optimisation
The Problem: Kubernetes Monitoring Noise is a Monster
Ever wonder which pod your Prometheus alert is yelling about? Which container? Which node? Seriously, which alert matters now? Without context, navigating alert storms is like hunting ghosts. My team wasted hours chasing effects, missing the causes.
Enter Robusta: Your Cluster’s AI Troubleshooter
Robusta merges AI diagnostics with event enrichment—triaging alerts, enriching context, even running remediations automatically. Imagine your grizzled SRE partner, but available 24/7 without coffee breaks.
Deployment and Usage
Deploy their Kubernetes operator with a single command:
kubectl apply -f https://robusta.dev/releases/latest.yaml
Configure alert tuning and auto-remediations with familiar YAML:
apiVersion: robusta.dev/v1alpha1
kind: Rule
metadata:
  name: pod-crash-loop-handler
spec:
  triggers:
  - "PodCrashLoopBackOff"
  actions:
  - "deleteProblematicPod"
Security warning: Automated remediation like pod deletion should be used cautiously. Always test rules in staging and ensure appropriate RBAC controls to prevent unintended disruptions.
Robusta logs everything and only disturbs engineers when problems persist. Say goodbye to endless noise.
A Tale From the Frontline
During a cascading pod failure caused by a misconfigured network policy, Robusta pinpointed the errant rule in minutes. We avoided hours of manual root cause hunts and a disastrous outage ripple. That was the “wait, what?” moment that made me a convert.
Limitations and Supplementation
Robusta excels in strong Prometheus ecosystems but isn’t a stand-alone solution. Its magic gets real when paired with log analysis and data observability tools. Not a silver bullet, but definitely a bullet in the chamber.
5. Comparative Analysis and My Candid Take
| Tool | Core Strength | Best For | Complexity / Deployment |
|---|---|---|---|
| Telmai | AI-driven data validation | Data pipelines & analytics | Moderate; integration with data lakes and warehouses |
| Better Stack | AI log analysis & incident management | SRE and incident response teams | Easy; agent-based deployment |
| Robusta | Kubernetes alert tuning & auto-remediation | Kubernetes ops with Prometheus | Moderate to advanced; operator deployment |
Use these tools wisely in concert and you assemble a layered observability fortress: from data quality, through logs, to cluster health.
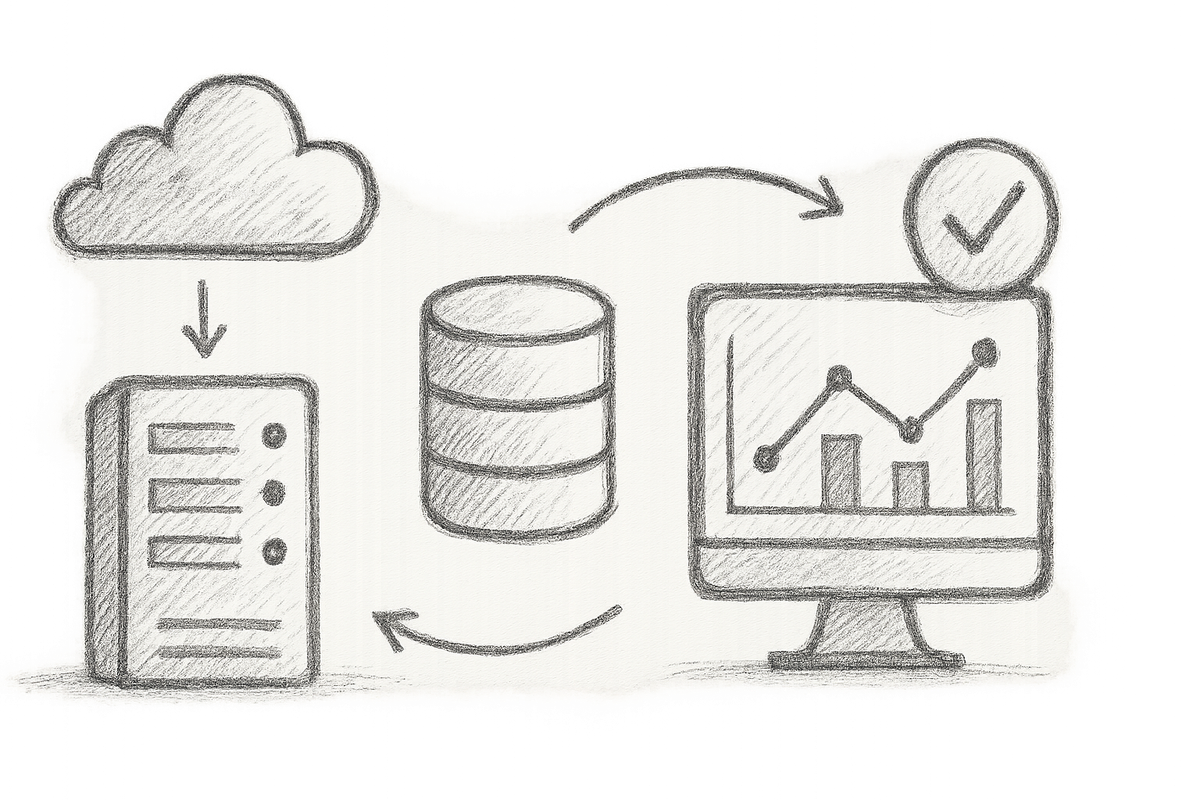
6. The Aha Moment: Rethinking Monitoring from Noise to Intelligence
Here’s the hardest truth: more monitoring isn’t smarter monitoring. Traditional tools bribe you to hoard data but punish engineers with noise overload. AI-powered observability distils intelligence instead of drowning teams in dashboards. It reduces toil and delivers operational empathy—because behind every alert stands a human craving clarity, not complexity.
7. Forward-Looking Innovation: The Future of AI in DevOps Monitoring
Brace yourself: AI is evolving from alerting to proactive prevention. Imagine causal inference AI and generative troubleshooting agents chatting with you, fixing issues before you know they exist. But hold the fanfare—over-automation risks “AI hallucinations” that worsen outages instead of mending them.
Standards like OpenTelemetry will democratise plug-and-play AI monitoring ecosystems. The future’s bright, but only if we remain vigilant.
8. Actionable Next Steps and Measurable Outcomes
- Pilot Telmai: Validate data quality in your critical pipelines; measure anomaly detection lead time.
- Deploy Better Stack agents: Quiet alert noise and reclaim on-call sanity.
- Integrate Robusta with Prometheus: Automate Kubernetes alert tuning and remediation.
- Track Results: Measure alert volume reduction, MTTD, MTTR improvements, and operational cost savings.
- Foster Operational Empathy: Remember, AI assists humans—not replaces them. Cultivate trust and collaboration.
By embracing these steps, your team won’t just monitor infrastructure—they’ll master it.
References
- Telmai Official - AI Data Observability Platform
- Better Stack Blog: MCP Server AI Incident Analysis
- Robusta.dev Kubernetes Troubleshooting
- Kubernetes v1.34 Release Notes and Blogs
- OpenTelemetry Standard
- The Counter-Intuitive Truth of Observability Overload
- Specialized Monitoring Solutions for Modern Applications
- Open-Source Observability Revolution
Final Thoughts
After decades of banging my head against the wall of monitoring madness, I’ve distilled one core truth: trust your tools, but verify the AI. Start small, measure results relentlessly, and never forget that monitoring is about people—human minds wrestling chaos into clarity.
These AI-powered platforms don’t just add shiny bells and whistles; they deliver an operational lifeline to teams desperate for clarity amid the madness. Embrace the revolution, but bring your battle scars and scepticism—you’ll need both.
Your next production incident might just be the one you avoid entirely.
Enjoyed this read? Don’t let the noise eat your sanity—build your AI-driven monitoring stack today.