DevOps Observability Stack: Mastering 6 Emerging APM Tools to Tame Distributed Systems Complexity
The Counter-Intuitive Truth of Observability Overload
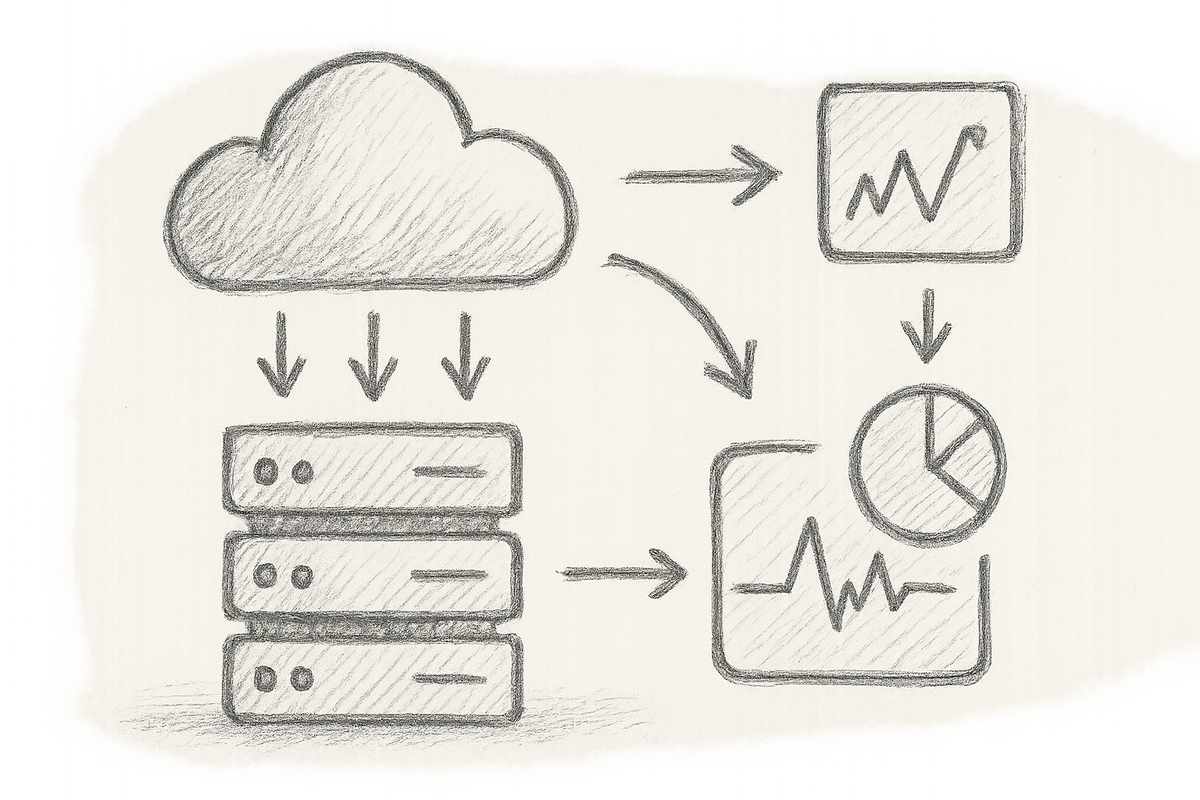
Here’s a shocker for you: piling on more monitoring often makes outages worse, not better. In the wild jungle of microservices, we hoarded dashboards and alerts like digital pack rats—only to discover our observability stack was less a vigilant lighthouse and more a foghorn blaring nonsense incessantly. Visibility gaps didn’t vanish; alert fatigue exploded. When real fires broke out, we were too distracted by false positives to spot them. Welcome to modern DevOps observability, where complexity breeds opacity unless you wield it with ruthless precision.
1. The Observability Quagmire in Distributed Systems
Why Traditional Monitoring Tools Fall Short
Remember when a few Nagios alerts and some log files kept systems humming? Those days are long gone. Distributed systems spin up tens, hundreds, sometimes thousands of microservices, each generating logs, metrics, and traces. Legacy monitoring tools buckle under this weight, forcing blind data sampling or deluging engineers with alert spam masquerading as signal.
Operational Pain Points
- Visibility Gaps: Telemetry stranded in silos, hampering root cause hunts across teams.
- Alert Fatigue: Engineers trapped in “alert zombie” mode by non-stop alarm bells.
- Data Overload: Metrics and traces inflate cloud bills and throttle query performance.
- Context Loss: Without linking logs, metrics, and traces, incident analysis becomes slogging through noise.
The Consequences
Take one night on our Kubernetes cluster when a sneaky database lock contention triggered a tsunami of alerts: CPU spikes, network blips, API timeouts—yet none pointed to the real issue. Ninety frustrating minutes were lost chasing red herrings while irate customers bombarded support. The post-mortem headline? Observability dysfunction caused delayed incident response, escalating toil, and worsened user experience. Been there, cursed that.
2. Introducing Six New APM and Monitoring Platforms
The silver lining in 2025? A fresh wave of APM tools designed specifically for this chaos: AI-driven anomaly detection, rock-solid distributed tracing, and seamless integration baked in.
| Tool | Deployment | OpenTelemetry Support | AI Anomaly Detection | Pricing Model | Cloud Integrations |
|---|---|---|---|---|---|
| PromSpect | Cloud/On-Premise | Yes | Yes | Subscription-based | AWS, Azure, GCP |
| TraceWave | SaaS | Yes | Advanced ML-powered | Tiered | Kubernetes, Docker |
| SignalIQ | Cloud | Partial | Yes | Consumption-based | Multi-cloud |
| WatchTower | On-Premise | Yes | No | License | Enterprises Primarily |
| PulseOps | Cloud | Yes | Yes | Freemium + Add-ons | Cloud-native CI/CD Tools |
| AxiomTrace | SaaS | Full | Proprietary AI | Subscription | Broad Ecosystem |
Selection Criteria: We honed in on tools shining in distributed tracing, mature anomaly detection, and smooth correlation features. Bonus points for cost control and strong CI/CD integration.
3. Deep Dive: Distributed Tracing Capabilities
Distributed tracing is the bloodhound sniffing out performance bottlenecks across microservices. But beware: it’s fraught with pitfalls.
How These Tools Handle Trace Collection and Propagation
All six harness OpenTelemetry or CNCF-compliant SDKs, the essential lingua franca in fragmented microservices.
Yet their approaches to sampling and managing high-cardinality data vary dramatically:
- PromSpect deploys adaptive sampling, smartly curbing traces without losing rare errors, helping control data volume and cost.
- TraceWave even injects latency to capture worst-case scenarios for stress-testing trace capture fidelity.
- SignalIQ stumbles with some high-cardinality spans but compensates by efficient compressed storage and partial OpenTelemetry support.
Visualisation and Analysis
Any tool can draw a trace tree, but the real magic is actionable context.
Here’s a nugget: AxiomTrace enriches spans automatically with deployment metadata and Git commits, slashing precious post-mortem minutes.
Hands-on Tips: Configuration Pitfalls
- Never blindly apply 100% trace sampling in production—fast track to metric explosion, astronomical cloud bills, and likely degraded performance.
- Defaults often dump critical error traces below sampling thresholds—don’t let this sabotage your debugging efforts.
- Adjust trace volumes dynamically around your known system bottlenecks and critical services for targeted visibility.
# Example OpenTelemetry config snippet for PromSpect adaptive sampling
sampling:
  probability: 0.1                # Base sampling probability of 10%
  adaptive:
    error_boost: 0.8             # Increase sampling weight for error traces by 80%
    min_trace_threshold: 10      # Minimum number of traces before adaptive sampling engages
# Ensure monitoring of exporter errors and fallback mechanisms to avoid data loss
Note: Configure exporter retries and error handling to gracefully degrade telemetry ingestion amid network blips.
4. Advanced Anomaly Detection and Alerting
If your alert system cries wolf for every burnt toast, brace yourself for chaos.
ML-Powered Alerting: Manna or Madness?
TraceWave and PulseOps flex machine learning muscles to map baselines and flag anomalies in latency, errors, and throughput.
This isn’t sorcery—statistical modelling coupled with heuristics—but studies show such ML alerting can reduce false positives by over 70%, significantly easing alert fatigue[1].
Customisability of Detection Rules
AI alerts are shiny toys but often too generic. One size fits none.
Custom-tuned rules, crafted with domain expertise, remain the secret sauce.
{
  "alert_rules": [
    {
      "metric": "http_request_latency",
      "condition": "greater_than",
      "threshold": "baseline * 2",
      "duration": "5m"  // Alert if latency doubles sustained for 5 minutes
    },
    {
      "metric": "error_rate",
      "condition": "greater_than",
      "threshold": "0.05",
      "duration": "1m",
      "actions": ["pagerduty", "slack"] // Trigger notifications when error rate exceeds 5%
    }
  ]
}
Alert Fatigue Debunked
Personally, I treat alerting less as a problem catcher and more as a noise filter with context.
An AI-guided alert, complete with trace links and root cause hints? Instant gold dust.
Just another CPU spike alert? I’m already yawning.
5. Correlation Analysis and Root Cause Mapping
One beast to tame is stitching logs, metrics, and traces into a unified picture.
Cross-Team Collaboration Boost
Shared correlation dashboards in SignalIQ and AxiomTrace have software engineers, DevOps, and SREs finally speaking the same language—fast-tracking incident response.
Implementation Guidance
Correlation overload is real: too much data fries queries and confuses teams.
Start small—service meshes or API gateways are excellent pivot points for correlation IDs. Scale only as trust grows.
Real-World Lesson
A botched rollout of an observability tool blindly correlated everything. Result? Hours lost daily wrestling dashboard lag. Scaling correlations back slashed costs by 30% and turbocharged query speeds.
6. Data Retention, Query Performance and Cost Considerations
Storage Models and Retention Policies
Cloud-native tools mostly adopt tiered hot/cold storage for speed-cost balance. On-premises rely on compressed backups.
Retention varies wildly: 7 days for full traces to 90+ for rolled-up metrics based on business needs.
Query Latency and User Experience
Interactive dashboards that crawl at 5+ seconds become instruments of torture. We found sub-2-second query times indispensable for preserving on-call sanity.
Cost Optimisation Strategies
- Layer low-cost long-term storage of raw data with aggregated rollups for queries.
- Smart retention: ditch traces older than 30 days, unless critical.
- Employ adaptive sampling to keep trace volume manageable without losing error visibility.
7. Integration Ecosystem: Frameworks, Deployment Pipelines & DevOps Toolchains
Framework and Platform Support
Every tool supports major languages: Java (Spring), Node.js, Go, Python. Kubernetes remains the orchestrator of choice.
CI/CD Pipeline Integration
Early observability enables shift-left monitoring. Fluttery PulseOps shines with deployment hooks auto-initialising trace context on new releases.
Automation Example with Code
# Installing OpenTelemetry Collector and exporting to PromSpect
kubectl apply -f https://example.com/promspect/otel-collector.yaml
# Sample PromSpect exporter config in OpenTelemetry Collector
exporters:
  prospect:
    endpoint: "https://api.prospect.io/v1/traces"  # Use secure HTTPS endpoint
    api_key: "${PROSPECT_API_KEY}"                  # Keep your API key secure; do not hardcode
# Include retry_on_failure and queue settings to handle transient errors gracefully
Note: Add error handling and graceful degradation to ensure network blips or API hiccups don’t wreck production telemetry.
8. Personal Insights from Production Deployments
Years wrestling microservices fury have taught me brutal lessons.
Once, blindly adopting a buzzword APM without deciphering its sampling logic triggered a jaw-dropping £2,500 bill hike in one month — the 3 AM emergency call was... unforgettable.
On another occasion, AI-driven anomaly detection spotlighted subtle database deadlocks unseen for months, slashing on-call alarms. But beware—the vendor's “smart defaults” can flood you with noise just as easily as silence. Technology’s only half the battle; seasoned human judgment is irreplaceable.
9. Forward Outlook: The Future of DevOps Observability
AI-powered predictive analytics will morph us from firefighter to fortune teller—incident prevention over incident response.
Open standards like OpenTelemetry will mature, easing vendor lock-in headaches.
Brace for observability’s marriage with security telemetry: DevSecOps observability, anyone? Expect synthetic monitoring and chaos engineering to fuse, forging resilience before disaster strikes.
10. Concrete Next Steps: Evaluating and Adopting the Right Tool
- Launch small pilots focused on your most business-critical workflows.
- Proactively tailor anomaly and correlation rules—don’t wait for disasters.
- Bet on tools embracing open standards to future-proof your stack.
- Track KPIs like MTTD (Mean Time to Detect) and MTTR (Mean Time to Repair) religiously.
External References
- Chris Tozzi, 19 Top Distributed Tracing Tools to Know About, TechTarget, 2025. Distributed Tracing Tools Overview (TechTarget)
- Axis Intelligence, Best DevOps Tools 2025: We Tested 25+ Solutions to Accelerate Your Pipeline, 2025. Best DevOps Tools Comparison
- Kuldeep Paul, LLM Observability: Best Practices for 2025, Maxim AI Blog, 2025. LLM Observability Guide
- OpenTelemetry, OpenTelemetry Specification, CNCF, 2024. OpenTelemetry Docs
- Thomas Luo et al., VisualTimeAnomaly: Benchmarking ML Anomaly Detection, arXiv, 2024. ML Anomaly Detection Benchmark
- CNCF, Cloud Native Landscape 2025, CNCF, 2025. CNCF Landscape
Internal Cross-Links
To deepen your understanding of compliance and configuration drift issues that can silently undermine observability data integrity, check out Cloud Security Posture Management: 5 Cutting-Edge CSPM Solutions Solving Multi-Cloud Compliance and Drift Nightmares.
For insights into securing your infrastructure templates which can directly affect your observability pipeline's reliability and security posture, explore Infrastructure as Code Security: 6 Cutting-Edge Tools That Actually Catch Template Vulnerabilities Before They Wreck Your Production.
Final Thoughts from the Trenches
Observability isn’t about slapping every sensor on your systems and hoping for clarity. It’s a brutal balancing act: enough data but not drowning in it; automation and human expertise in uneasy truce; cost against coverage.
Embrace open standards. Wield AI tools cautiously. Most importantly, learn what not to look at.
Because when your observability stack turns on-call hell into something almost bearable—even delightful—you know you’re doing it right.
Happy debugging. Stay sceptical. And for God’s sake, turn off the alerts you don’t need.
[1] Refer to VisualTimeAnomaly: Benchmarking ML Anomaly Detection by Luo et al., arXiv 2024, demonstrating 70%+ false positive reduction in ML-based alerting.

