Next-Gen Log Management Solutions: Mastering Distributed System Analytics with Six Cutting-Edge Tools
Why Your Logs Are Screaming—and Nobody’s Listening
What if I told you your entire log management system is a ticking time bomb, silently eroding your ability to troubleshoot when disaster strikes? If wading through endless gigabytes of log data feels like spotting a needle in a data haystack, you’re not alone. Logs from sprawling microservices don’t “trickle” anymore; they flood in torrents—tens or hundreds of gigabytes an hour per cluster. Traditional tools, built for whispering monoliths, choke on this roar. The consequences? Delayed incident detection, furious on-call engineers pulling all-nighters, and downtime costs that make CFOs cringe.
I’ve buried myself in those fire drills. Once, a cascading failure in a multi-tenant system had our team scrambling blindfolded because legacy log tools returned search results so slowly, we couldn’t trace the root cause before systems went offline. That night, “log spelunking” felt more like a rescue mission without a map—a scenario none of us should ever accept as “normal.” So, what if next-gen log platforms could actually transform this chaos into clarity and let you slash your mean-time-to-detect (MTTD) and mean-time-to-resolve (MTTR)?
Let me take you through six battle-tested, production-ready log tools that have already done exactly that—turning unmanageable log floods into an observability power play for distributed systems.
The Distributed Log Management Nightmare (Stay With Me)
Picture a single user request bouncing wildly across a dozen microservices, each spewing fragments of log data asynchronously across regions and clouds. Piecing these together to diagnose issues? It’s less forensic science, more “Where’s Wally?” without the stripes. Imagine drilling down on event timings only to find your search queries time out or return garbage because legacy tools buckle under volume. Retaining logs for forensic and compliance purposes only bloats costly storage further—and gives your security team nightmares. False positives flood alert channels, draining precious engineering sanity and time.
Here’s a "wait, what?" moment: did you know that in such environments, MTTD and MTTR can balloon from minutes to hours because your tools simply can’t keep up? I’ve seen entire teams ground to a halt trying to filter noise from signal while your revenue and user trust hemorrhage in the background.
Adding AI-powered observability tools, like the ones discussed in Intelligent Infrastructure Monitoring: 7 Machine Learning-Powered Observability Tools Delivering Predictive Insights and Rapid Root Cause Analysis, can ease this toil. But even then, what you need is a log platform armed for the scale, complexity, and velocity of modern distributed systems.
Six Next-Gen Log Platforms That Turn Log Chaos Into Control
Vector: Rust-Powered Lightning-Fast Log Pipeline That Won’t Ghost Your Data
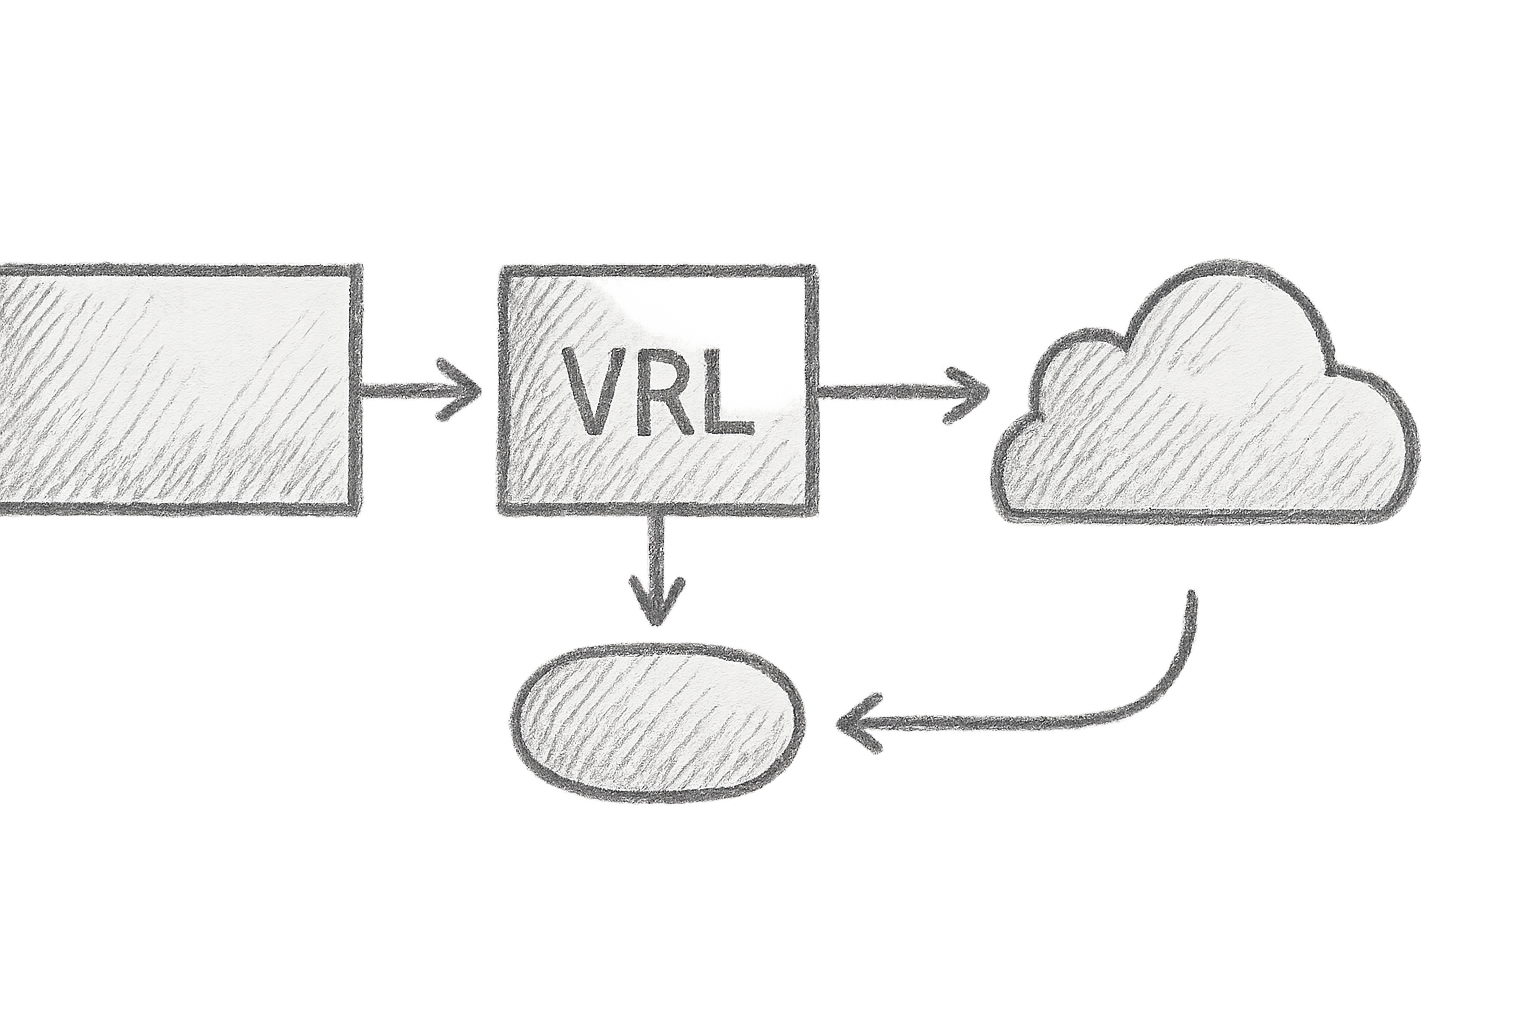
Vector’s a revelation—a log collector coded in Rust that’s as lean as a greyhound and as furious as one chasing a hare. Acting as agent, daemon, sidecar, or aggregator, it bends effortlessly to complex topologies. Its own programmable language, VRL, lets you perform powerful, on-the-fly transformations—think redacting sensitive data like social security numbers before they ever hit storage, saving compliance headaches and controlling risk.
Here’s a snippet I’ve customised to filter out sensitive PII for one of our regulated clients—run this and watch your logs morph before your eyes, all safely and silently:
sources:
  k8s_logs:
    type: kubernetes_logs     # Source: capture logs from Kubernetes pods
transforms:
  redact_ssn:
    type: remap               # Transform using Vector Remap Language (VRL)
    inputs: [k8s_logs]
    source: |
      .user.ssn = redact_string(.user.ssn)  # Redact SSNs to protect PII complying with privacy laws
sinks:
  elasticsearch:
    type: elasticsearch       # Sink logs into Elasticsearch cluster
    inputs: [redact_ssn]
    endpoint: "http://elasticsearch:9200"
    index: "app-logs-%Y.%m.%d"
Note: Vector’s VRL scripting enforces fail-safety: any parse or transformation errors do not drop events silently but route them to a dedicated error stream, allowing proactive fixes before logs hit production storage. Remember to secure in-transit data with TLS enabled on all endpoints to prevent interception of sensitive logs.
Humio (aka CrowdStrike Falcon LogScale): Index-Free Beast with Petabyte-Scale Mojo
Imagine ingesting over a petabyte of logs daily yet getting query results in under a second. No indexes, no bottlenecks—just raw, compressed data stored and searched with surgical precision. Humio’s unique repository architecture sidesteps traditional indexing headaches, making it a dream for security teams hunting sophisticated threats. Its query language is like an industrial multitool, with regex, aggregations, joins and more—optimised for scale and agility (Humio Docs).
Reports indicate Humio customers have realised up to $9 million in operational savings over three years, driven by improved ingestion efficiency and sharper alerting workflows, especially in large-scale environments known for challenging data volumes.
Sematext Logs: Cloud-Native with Sherlock Holmes-Level Auto-Discovery
Sematext feels like a sixth sense for logs, combining cloud-native ease with smart auto-discovery across Kubernetes, containers, and native cloud platforms. Its search is Lucene-powered but turbocharged for incident investigations—the engine handles parsing and structuring, so you don’t spend half your life writing complex queries during emergencies.
My take? The seamless integration into CI/CD pipelines caught me off guard—it spotted pipeline failures before our engineers did. Talk about early warnings. Their auto-discovery and tagging reduce operational overhead significantly (Sematext Logs).
Grafana Loki: The Budget-Friendly Grafana Native That's Actually Worth It
Loki takes a lightweight approach with minimal indexing—just labels, not the logs themselves. Yet, it remains an unstoppable force in high-rate, cost-efficient ingestion. Integrating tightly with Grafana, it lets you correlate logs with metrics naturally. This is multi-tenant-friendly and has evolved beyond its beta infancy into a fully mature toolset.
Example Promtail configuration (our workhorse for pulling logs into Loki):
server:
  http_listen_port: 3100   # HTTP server port for Loki API

clients:
  - url: http://loki:3100/loki/api/v1/push  # Loki push API endpoint

scrape_configs:
  - job_name: system
    static_configs:
      - targets:
          - localhost
        labels:
          job: varlogs       # Label for log source
          host: server1
    pipeline_stages:
      - docker: {}           # Parse Docker JSON logs
      - regex:
          expression: "level=(?P<level>\\w+)"  # Extract log level field
Pro tip: While Loki uses light indexing on labels, it scales effortlessly in production clusters without breaking budgets—a rare and delicious balance. Ensure you monitor ingestion rates carefully and tune label cardinality to avoid scaling challenges (Loki Docs).
Coralogix: AI-Powered Signal in a Sea of Noise
Coralogix deploys AI not as a flashy gimmick but as a practical ally in taming log noise. It auto-detects anomalies, clusters related events, and alerts intelligently—cutting lengthy incident response cycles drastically. Acting at the stream’s edge with on-prem lightweight collectors, it meets tight security and data governance demands, making it perfect for enterprises walking the regulatory tightrope.
Personally, when we integrated Coralogix, our support tickets dropped overnight—fewer false alerts = fewer fire drills = more sleeping engineers. Indeed, their AI-driven noise reduction technologies deliver measurable MTTR reductions (Coralogix AI Overview).
Logz.io: Open Source Legacy with Enterprise Wizardry
Built on trusted open source (Elasticsearch, Grafana), Logz.io adds the polish and robustness enterprises crave, blending scalable log analytics with security event management. It’s feature-rich, with user behaviour analytics and predictive capabilities baked in, but a word of caution: expect a price premium that some leaner operations may balk at.
For teams balancing advanced security event management and compliance with practical usability, Logz.io’s tiers accommodate varying organisational needs, though budget-conscious teams should factor in the costs (Logz.io Platform).
The “Aha” Moment: Logs Are Not Just Logs Anymore
Here’s the kicker: most platforms aren’t just collecting lines of text—they’re transforming them into richly contextualised, event-driven streams. Imagine logs smartly annotated with service identities, geographical data, request IDs, and anomaly flags, all stitched seamlessly with traces and metrics. This isn’t magic; it’s a radical restructuring that shaves hours off diagnostics by removing manual log spelunking.
This contextual intelligence shift dovetails with the automation wave sweeping through DevOps pipelines, as I explored in Modern Git Workflow Tools: 8 Game-Changing Utilities to Boost Branching, Review, and Merge Efficiency. Automation and integration simply win.
Implementation Wisdom: Best Practices From the Trenches
- Deploy close to the source: Agents like Vector or Promtail should run near your workloads to minimise latency and data loss risk.
- Scale smartly: Shard and partition ingestion pipelines horizontally to handle bursts without choking.
- Lock it down: Enable TLS encryption for data in transit, enforce role-based access controls, and audit every access event to meet compliance standards.
- Custom dashboards rule: Build dashboards tailored to your service patterns and operational scenarios to avoid ‘alert fatigue’—that insidious productivity killer.
- Stay vigilant: Automate pipeline health monitoring and fail-safes to catch issues before they become outages.
Benchmarks and The Bottom Line
Humio dazzles with sub-second queries at petabyte scale. Vector’s memory footprint remains surprisingly tiny, even under heavy load thanks to Rust efficiency and VRL fail-safe scripting. Loki’s innovative label indexing slashes operational costs dramatically, making it attractive for cost-conscious teams. Compression ratios vary from 3:1 to 7:1, depending on log variety and tool, so don’t underestimate storage savings (Observability Trends 2025 — CNCF Report).
Be prepared for pricing disparities: AI-driven platforms like Coralogix and Logz.io carry premium tags but deliver measurable MTTR reductions and improved alert accuracy.
The Road Ahead: AI and Open Standards Are Your Allies
Artificial intelligence is no longer a buzzword; it’s evolving into autonomous log sentinels, proactively detecting anomalies and predicting issues before they flare. Meanwhile, OpenTelemetry’s standardisation promises an interoperable future, reducing siloes and easing multi-tool observability integrations (OpenTelemetry Project).
Your Next Steps: From Trial to Triumph
Start with a non-production pilot—deploy an agent like Vector or Promtail in a controlled environment. Measure key metrics: MTTD and MTTR before and after deployment. Don’t “set and forget”: tune pipelines and retention policies like a watchmaker, iterating until your observability suite hums like a well-oiled machine.
No magic bullet exists. But armed with these tools—each suited for different scales and operational philosophies—you can finally tame your distributed logging nightmare and turn logs into your organisation’s sharpest intelligence asset.
External References
- Vector Documentation
- CrowdStrike Falcon LogScale (Humio) Overview (Note: Currently redirected; refer to official Humio documentation)
- Sematext Logs
- Grafana Loki Docs
- Coralogix Official Site
- Logz.io Platform
- OpenTelemetry Project
- Observability Trends 2025 — CNCF Report
Internal Cross-Links
- Intelligent Infrastructure Monitoring: 7 Machine Learning-Powered Observability Tools Delivering Predictive Insights and Rapid Root Cause Analysis
- Modern Git Workflow Tools: 8 Game-Changing Utilities to Boost Branching, Review, and Merge Efficiency
Next time you face a mountain of logs, remember: not all tools are created equal, but with the right arsenal, your logging nightmare can be the success story your team brags about.
Ready to stop drowning in logs? Your journey starts here.