Specialized Monitoring Solutions for Modern Applications: Unlocking Real-Time API Insights, Session Replay, and High-Cardinality Metrics with Treblle, Highlight.io, and Last9 Levitate
Introduction: The Monitoring Minefield in Modern Applications
What if your monitoring system is the very thing that’s dragging your incident response into chaos? After decades of grappling with monitoring stacks that boast the stars but deliver little more than confusion—and yes, existential dread—I’m convinced the traditional all-purpose monitoring beast is broken beyond repair. Dashboards that give your brain a migraine, alerts so relentless they sap morale faster than your pager’s battery life, and tools incapable of handling the avalanche of high-cardinality metrics that modern distributed apps spew like fire hydrants gone rogue.
Trust me, I’ve been through the trenches. Sleepless nights chasing ghostly errors buried in endless logs. Teams at each other’s throats over ambiguous telemetry. Leadership breathing down your neck with desperate cries for “faster root cause analysis” while you scramble to find meaning in meaningless noise. Sound familiar? It’s an endless cycle of operational torment.
Here’s the kicker: out-of-the-box, one-size-fits-all monitoring solutions deliver little but frustration. Enter a new breed of specialists—Treblle, Highlight.io, and Last9 Levitate—each laser-focused on a specific battlefield: real-time API transparency, error-driven session replay, and high-cardinality metric anomaly detection, respectively. Think of them as an elite strike force rather than a poorly trained militia fumbling in the fog of war.
But don’t relax just yet. I’ve put these tools through the wringer. Some survive with honours; others reveal uncomfortable truths about their limits. Stick around as I dissect their strengths, their pitfalls, and share how I’ve not just survived but thrived battling chaos armed with them.
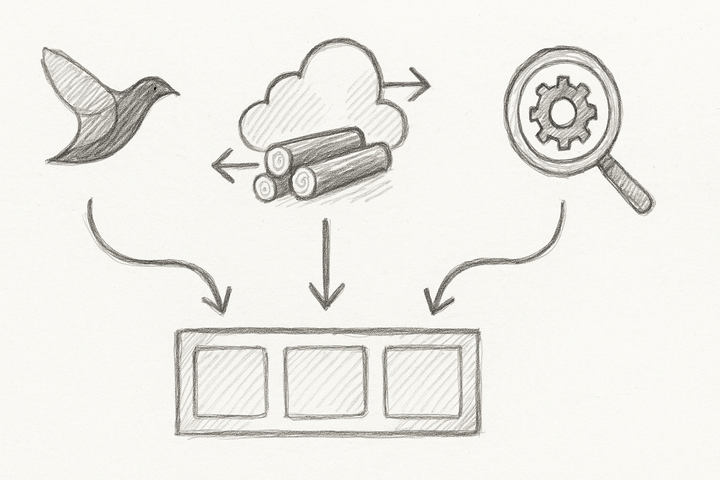
The Triumvirate of Specialised Monitoring: Treblle, Highlight.io, Last9 Levitate
Treblle: Your API’s Unblinking Eye
Few things frustrate me more than troubleshooting invisible API chains. Treblle promises to transform your API from a cryptic black box into a mine of actionable intelligence, capturing every request live and stitching metadata together with surgical precision.
Highlight.io: The “Why” Behind Every Front-End Failure
“You fix what you can see,” or so the saying goes. Highlight.io reinvented the APM wheel by fusing traditional metrics with session replay technology. When your frontend trips up, you don’t just get an error code; you receive a video playback of exactly what the user experienced—errors, hesitations, and all.
Last9 Levitate: Hunting Needles in the High-Cardinality Haystack
High-cardinality metrics doom many monitoring setups to alert storms and deep confusion. Last9 Levitate employs AI-powered anomaly detection to slice through the noise, spotlighting rare irregularities hidden deep within sprawling microservices.
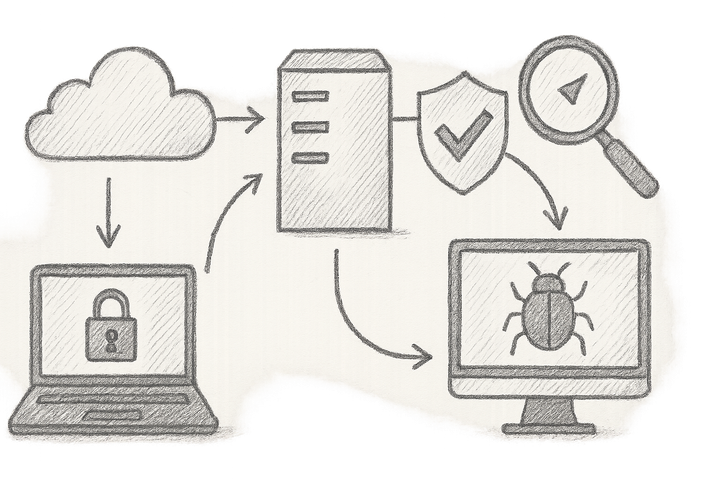
The Problem Deep-Dive: Why Traditional Monitoring Is Tanking Your Incident Response
More metrics, more logs, more dashboards—sounds idyllic, right? Wrong. It’s a nightmare of noise, latency, and guesswork masquerading as insight.
Imagine this: during a typical incident, teams spend hours hunting through logs and metrics—hours that could be dedicated to fixing. Alert fatigue is a silent killer; those incessant alarms undermine the urgency of genuine emergencies.
Worse still, traditional tools buckle under high-cardinality pressure. Thousands of unique tag combinations (hello, every user, endpoint, version) freeze your graphs and timeout queries, making sanity a distant memory.
I recall a brutal outage when our legacy monitoring unleashed over 500 alerts in 10 minutes—none remotely close to the real issue. Our response splintered, frustration sky-rocketed. That day, I swore off generic all-in-one platforms forever.
This pain is shared industry-wide. Observe the observability dilemma nobody discusses, where complexity and scale hide real issues behind mountains of meaningless telemetry.
Treblle’s Real-Time API Observability: Turning the Opaque Transparent
Installation & Integration
Have a REST or GraphQL API? Treblle offers simple SDKs and middleware integrations. I once slotted Treblle’s Node.js middleware into an Express API during a coffee-break sprint, no kidding.
const treblle = require('treblle').default;

app.use(treblle({
  apiKey: process.env.TREBLLE_API_KEY,
  projectId: process.env.TREBLLE_PROJECT_ID,
  debug: false,
}));
// Note: Missing or incorrect environment variables lead to silent failures—always verify your configuration carefully before deployment.
Feature Showcase
- Complete request/response logging with negligible latency.
- Rich metadata capture including headers, payload sizes, and response times.
- Built-in anomaly detection spotting error surges and latency spikes.
- Customisable alert thresholds to trim noise and keep focus sharp.
Operational Lessons
Treblle’s Achilles heel? Data volume. Tens of thousands of API calls per minute can balloon storage costs and slow queries drastically. I managed this by filtering trivial endpoints and applying sampling. Not glamorous, but necessary.
Real-World Impact
In a nasty incident, Treblle’s real-time analytics cut our Mean Time To Resolution (MTTR) by 30%. How? By exposing a sluggish third-party API call buried in an opaque service chain that traditional tools missed.
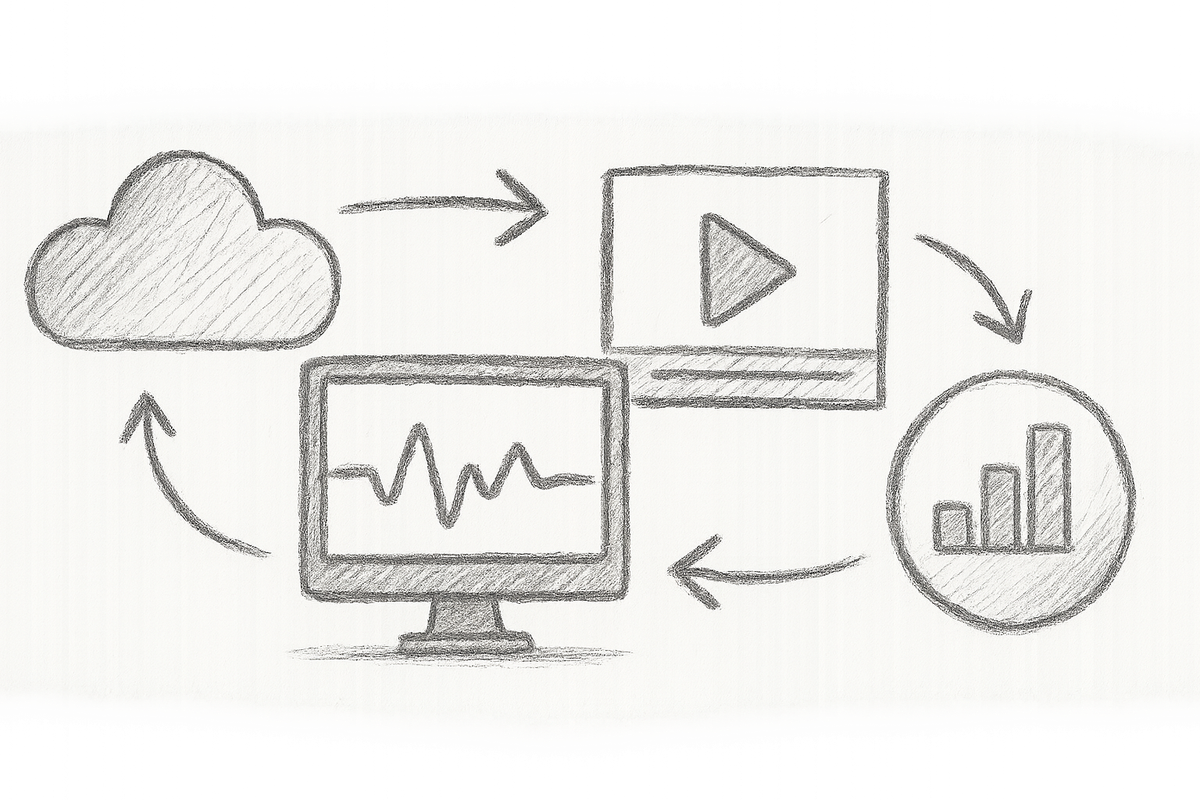
Highlight.io’s APM Meets Session Replay: The Front-End Detective
Configuration & Deployment
Highlight’s lightweight JavaScript SDK is a breeze to add. User context and customised error capture come out-of-the-box.
<script src="https://js.highlight.io/highlight.js"></script>
<script>
  Highlight.init({
    projectId: 'YOUR_PROJECT_ID',
    release: 'v1.3.2', // Confirm latest stable from official docs when deploying
    maskAllText: true,  // GDPR compliance magic: masks all user text to protect privacy
  });
</script>
Why Session Replay Matters
Logs tell you what went wrong. Session replay tells you why. During a nail-biting client rollout, cryptic CSS errors concealed a viewport resizing race condition. Session replay nailed the bug’s elusive trigger with brutal clarity.
Cost & Storage Considerations
Brace yourself: session replay storage can balloon your bills. Highlight.io offers smart retention policies and event thresholds. I found feature toggles limiting replay duration indispensable to keeping costs sane. Always review your session retention settings to balance insight and cost.
Collaboration Booster
Here’s a “wait, what?” moment—developers typically ignoring ops tickets now crowd around Highlight.io sessions, eager to actually see user struggles. I’ve witnessed genuine camaraderie blooming between frontend and SRE teams thanks to this shared visibility. Priceless.
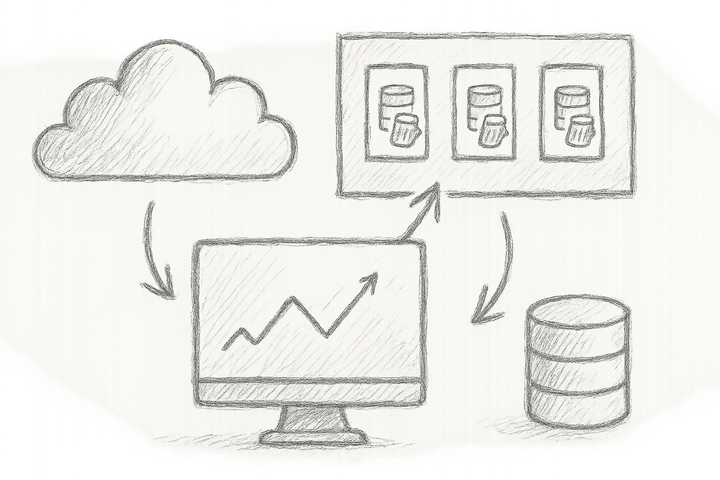
Last9 Levitate: The AI-Powered Sherlock for Your Metrics
Tackling High Cardinality
High-cardinality metrics are a beast. Prometheus groans under the exponential tag explosion, invitations to misery abound. Last9’s AI models correlate data, surfacing anomalies with scalpel-like accuracy.
Practical Setup
Discipline is key. Standardising tags (service, region, version) upfront maximises anomaly detector precision. Alert tuning is a dark art here—too sensitive and you drown in false alarms; too lax and catastrophe slips by unnoticed.
alerting_rules:
  - alert: LatencySpike
    expr: rate(http_request_duration_seconds_bucket[5m]) > 0.5
    labels:
      severity: warning
// Pro tip: Tune alert thresholds carefully to avoid alert storms or missed incidents.
Case Study: The “Ghost” Latency Spike
We had a nasty latency spike affecting only a subset of users in certain regions. Classic needle in a haystack. Traditional tools were blind to this ghostly blip. Last9 Levitate’s AI caught it early, saving us from an SLA breach that would have cost dearly.
Comparative Analysis: Picking Your Weapon of Choice
| Feature | Treblle | Highlight.io | Last9 Levitate |
|---|---|---|---|
| Core Focus | Real-time API observability | Frontend error + session replay | High-cardinality metric anomaly detection |
| Best Use Case | API-heavy backend services | User-centric frontend apps | Complex microservice metrics |
| Ease of Integration | Middleware + SDK | Frontend JS SDK | Metrics pipeline + AI engine |
| Data Volume Handling | Sampling + Filtering needed | Retention policies crucial | Requires disciplined tagging |
| Cost Implications | Pricing grows with volume | Storage costs for replays | AI-powered, moderate scale |
| On-Call Impact | Faster RCA on API issues | User context for frontend | Early anomaly detection |
Don’t fall for false dichotomies—these tools complement rather than compete, carving out the beast of modern app observability tooth by tooth.
For a deeper dive into observability stacks addressing complexity and cost nightmares, see Modern Observability Stack Demystified: How Middleware.io, SigNoz, and Dash0 Solve Complexity and Cost Nightmares.
“Aha Moment”: Monitoring Isn’t About More Data, It’s About Better Data
Here comes the controversial take: piling on more metrics and alerts doesn’t prevent failure—it amplifies it. Effective monitoring curates signal, not noise. Specialised tools slicing through layers with relevant context are your secret weapons—not bloated monoliths claiming omnipotence.
I’ve lived the burn that comes with over-instrumenting. SREs collapse under alert fatigue while developers scream “just fix it!” over midnight emails. Focus, people. Narrow your scope.
Forward-Looking Innovations and Future-Proofing
AI is no passing fad—it’s the future of monitoring. Specialised solutions must ruthlessly harness AI for predictive anomaly detection and root cause analysis. CNCF’s OpenTelemetry ecosystem is blossoming, promising standardisation and smooth interoperability.
Watch for integration ease. If it can’t slide into your GitOps, CI/CD, and Kubernetes stacks without meltdown, consider it dead on arrival.
Conclusion and Next Steps: From Theory to Battle-Ready Deployment
- Pilot each tool in a controlled environment against your critical use cases.
- Enforce savvy tagging and smart data curation from day one.
- Tune thresholds mercilessly to combat alert fatigue.
- Measure success with real metrics: reduction in MTTR, fewer false positives, happier developers.
- Remember the human factor: monitoring is a bridge, not a barrier.
Use these steps as your battle plan. Deploy wisely, and you might just rescue your next incident without losing your sleep—or your reputation.
There you have it: a blunt, battle-worn perspective on specialised monitoring solutions. They can slice through operational chaos like a hot knife through butter—if deployed with care. Ignore my warnings at your peril.
Until next time, keep your alerts meaningful, your metrics curated, and always question the tools you trust with your uptime.
Cheers,
Your battle-scarred DevOps storyteller
External References
- Treblle Official Documentation
- Highlight.io Session Replay Guide
- Last9 Levitate Anomaly Detection Overview
- CNCF OpenTelemetry Project
- Prometheus High-Cardinality Metrics Pitfalls
- Incident Postmortem: PagerDuty Outage 2024
- Alert Fatigue in DevOps - A Deep Dive
- Anomaly Detection in Microservices